
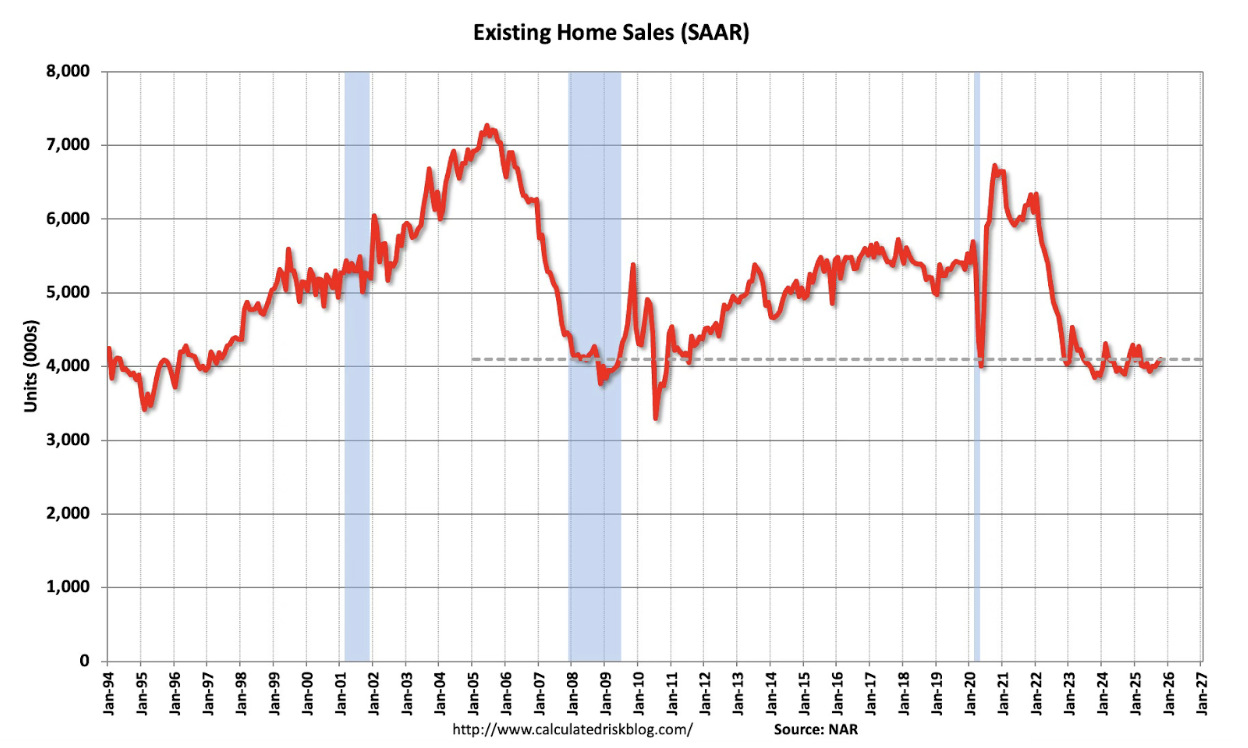
The Existing Home Sales January 2026 report shows declining transaction volume, stable pricing, and continued inventory constraints. According to the National Association of REALTORS®, sales fell 8.4% month over month while affordability improved for the seventh consecutive month. For the Nashville housing market and Middle Tennessee real estate, this reflects a liquidity adjustment rather than a price correction.
Market Summary
January data signals slower activity but structural stability.
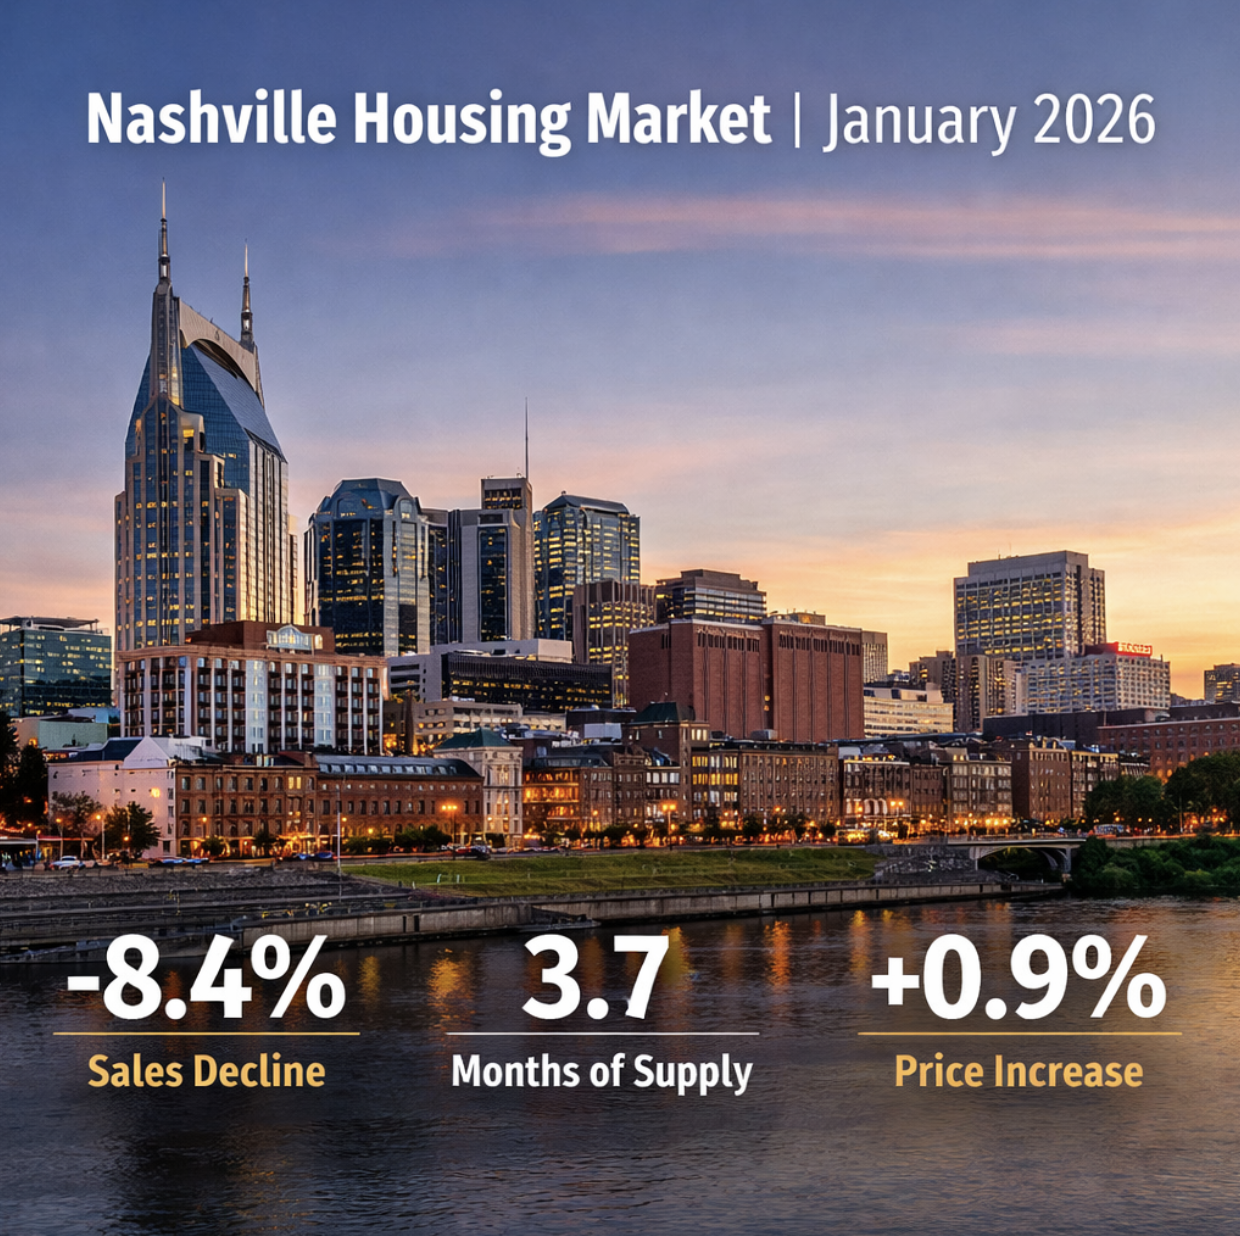
- Existing home sales declined 8.4% month over month to a 3.91 million annual rate.
- Median price rose 0.9% year over year to $396,800, extending 31 consecutive months of annual gains.
- Inventory stood at 1.22 million units, equal to 3.7 months of supply.
- The Housing Affordability Index increased to 116.5.
- The average 30 year fixed mortgage rate was 6.10%, down from 6.96% one year ago.
Sales volume softened. Pricing held. Supply remains the limiting factor.
National Liquidity Conditions
Existing home sales declined 4.4% year over year, with every region posting monthly and annual decreases.
Single family sales dropped 9.0% month over month. Condo and co op sales declined 2.6%. Median days on market rose to 46 days.
Distressed sales accounted for just 2% of transactions. Cash sales represented 27%, and investors comprised 16%.
This is not recessionary pressure. It is constrained turnover driven by limited listing growth.
Pricing and Supply Mechanics
The median existing home price reached $396,800 in January, up 0.9% from one year earlier. Single family median prices rose 0.6%, while condo and co op prices increased 3.8%.
With supply at 3.7 months, the market remains below the 5 to 6 month range typically associated with balance. Limited inventory continues to prevent broad price deterioration.
Affordability has improved due to lower mortgage rates compared to a year ago and steady wage growth. However, homeowners holding lower legacy mortgage rates continue to restrict new listings. The core constraint remains supply elasticity.
Regional Context and Southern Stability
Sales declined across all four regions. The West showed mild price softness, while the South remained essentially flat at +0.1% year over year.
For the Nashville housing market, the Southern stability matters most. The region is not accelerating, but it is not contracting materially either.
National data frames the backdrop. Local supply drives outcomes.
Nashville and Middle Tennessee Translation
Recent Greater Nashville REALTORS® data indicates that inventory growth in Davidson County remains gradual. Absorption in neighborhoods such as Green Hills and Forest Hills reflects supply discipline rather than oversupply. Williamson County, including Brentwood, shows greater rate sensitivity at higher price tiers but no broad price compression.
In Germantown and Downtown Nashville, longer days on market are appearing primarily in listings priced above recent comparable sales. Correctly positioned properties continue to transact.
This is not a broad correction in Nashville real estate. It is a normalization phase tied to mortgage rate adjustment and constrained listing growth.
For sellers in Brentwood and Green Hills, pricing precision is critical. Overpricing results in extended marketing periods rather than immediate price collapse.
For buyers in Davidson County, selective leverage is emerging where days on market exceed 45 days, particularly above median price tiers.
For Airbnb investment properties in Nashville, conservative underwriting remains essential. Regulatory exposure, insurance costs, and seasonal occupancy variance must be modeled carefully even in a supply constrained environment.
Structural Outlook for 2026
Sales volume is softer. Prices are stable. Affordability is improving. Supply remains constrained.
If mortgage rates remain near current levels and listing growth gradually expands through the spring cycle, Nashville and Middle Tennessee real estate should continue normalizing rather than declining.
Inventory growth in Davidson and Williamson Counties will determine liquidity conditions more than national headlines.
Liquidity, not emotion, will define the Nashville housing market in 2026.
Frequently Asked Questions
The January Existing Home Sales January 2026 report raises practical questions for buyers, sellers, and investors evaluating the Nashville housing market. The answers below focus on supply mechanics and regional dynamics.
Are home prices falling in 2026?
No. The national median existing home price rose 0.9% year over year in January, extending a 31 month streak of annual gains. With inventory still below balanced levels, pricing remains supported. In Nashville and Middle Tennessee, neighborhood level supply continues to determine price behavior.
Is the Nashville housing market shifting toward buyers?
Not broadly. A balanced market typically requires 5 to 6 months of supply, and current conditions remain below that range. Negotiation flexibility is emerging in higher price brackets in Brentwood and parts of Green Hills, but supply constrained segments remain competitive.
Why are existing home sales down if affordability improved?
Affordability improved due to lower mortgage rates compared to a year ago and stable wage growth. However, many homeowners remain locked into lower mortgage rates from prior cycles, limiting new listings. Improved buyer capacity combined with restricted supply reduces turnover rather than prices.
How do mortgage rates influence Nashville real estate in 2026?
The average 30 year fixed mortgage rate was 6.10% in January. Lower rates improve affordability at the margin but do not automatically increase supply. In Nashville and Williamson County, rate sensitivity is most visible in discretionary move up and luxury segments.
What should buyers and sellers in Middle Tennessee focus on now?
Sellers should focus on realistic pricing and absorption timelines. Buyers should evaluate submarket specific inventory conditions rather than national headlines. In Nashville real estate, strategy must align with neighborhood level supply and liquidity.

Check out this article next